Good Airbnb Occupancy Rate Benchmarks
A good Airbnb occupancy rate is not one universal number. This guide shows small hosts how to calculate it properly, compare it locally and decide what to change first.
The short version
- A good Airbnb occupancy rate is local, seasonal and profit based, not just a national average.
- Use booked nights divided by open nights for day to day operations, and report calendar occupancy separately if you use the property yourself.
- RevPAN, or revenue per available night, tells you more than occupancy because it combines rate and demand.
- Small hosts should review gap nights, minimum stays, cleaning turns and channel mix every month.
- If you are full too far ahead, raising prices may beat chasing even more occupancy.
What is a good occupancy rate for Airbnb? For most small hosts, good means you are close to or above similar local listings, at a nightly rate that leaves profit after cleaning, commission, utilities and wear. A useful working range is often 55% to 75% for year round city stock, lower for seasonal leisure homes, and higher only when the rate still holds.
AirDNA gives a United States average Airbnb and Vrbo occupancy rate of 54.3%, but also warns that averages hide big differences by market, season and property type in its Airbnb occupancy rate analysis. Treat that number as a sanity check, not a target.
The best occupancy rate is the lowest occupancy that still hits your profit target.
Quick answer: what is a good Airbnb occupancy rate?
For a host with 1 to 10 units, I would start with this operating benchmark, then replace it with your own local comp set within 30 days. The ranges below are practical targets, not promises. They sit around the national average published by AirDNA and the open night calculation used by market data providers such as AirDNA and BNBCalc, both of which exclude host blocked nights when judging booking performance AirDNA occupancy method and BNBCalc occupancy definition.
| Property and market type | Working annual target | High season pattern | Pricing note | Main risk |
|---|---|---|---|---|
| Major city apartment | 60% to 75% | Demand spread through the year | Watch weekday value and event spikes | Too much cheap last minute demand |
| Mature urban short let | 55% to 70% | Business, leisure and visiting family mix | Protect peak dates, fill midweek gaps | Ranking falls if reviews slow |
| Coastal or ski let | 40% to 65% | Very full peak months, quiet low season | Peak ADR must carry winter | Discounting the wrong season |
| Rural retreat | 35% to 60% | Weekends and school holidays | Package longer stays and pets if allowed | Empty weekdays |
| New listing first 60 days | 30% to 50% | Reviews matter more than perfect rate | Use launch pricing with an end date | Staying cheap after proof exists |
| Large family home | 35% to 60% | School holidays, events, reunions | Lower occupancy can still win on ADR | Too many cleaning turns |
If you sit above 85% for long periods, especially more than 60 days before arrival, assume you may be underpriced until proved otherwise. BNBCalc gives the example of a plan that needs 85% occupancy being well above a market where similar homes book about 55% of open nights, which is a useful warning against building a budget on heroic occupancy BNBCalc occupancy guide.
Airbnb occupancy rate formula and calculator
The Airbnb occupancy rate formula is simple:
Airbnb occupancy rate = booked nights ÷ available nights × 100
Booked nights are nights with a confirmed reservation. Available nights, also called open nights, are nights guests could actually book. Owner stays, maintenance blocks, refurbishment periods and regulation blocks should not sit in the denominator when you are judging listing performance. Cancelled nights should be treated according to what happened next: if the night reopened and sold, count the replacement booking, if it stayed empty, it remains an open unbooked night.
Use this Airbnb occupancy rate calculator in Google Sheets or Excel. The formulas are included in plain text so you can copy them.
Month: {January}
Total nights: {31}
Owner blocked nights: {2}
Maintenance blocked nights: {2}
Open nights: ={total nights} minus {owner blocked nights} minus {maintenance blocked nights}
Booked nights: {18}
Occupancy: ={booked nights} divided by {open nights}
ADR: ={gross room revenue} divided by {booked nights}
Gross revenue: {room revenue plus cleaning income}
Cleaning turns: {number of stays}
Variable cost: ={cleaning turns} times {cleaning cost} plus {booked nights} times {nightly variable cost}
Net revenue: ={gross revenue} minus {platform commission} minus {variable cost}
RevPAN: ={net revenue} divided by {open nights}
Next action: {raise price, reduce gaps, improve photos, open channel, hold}
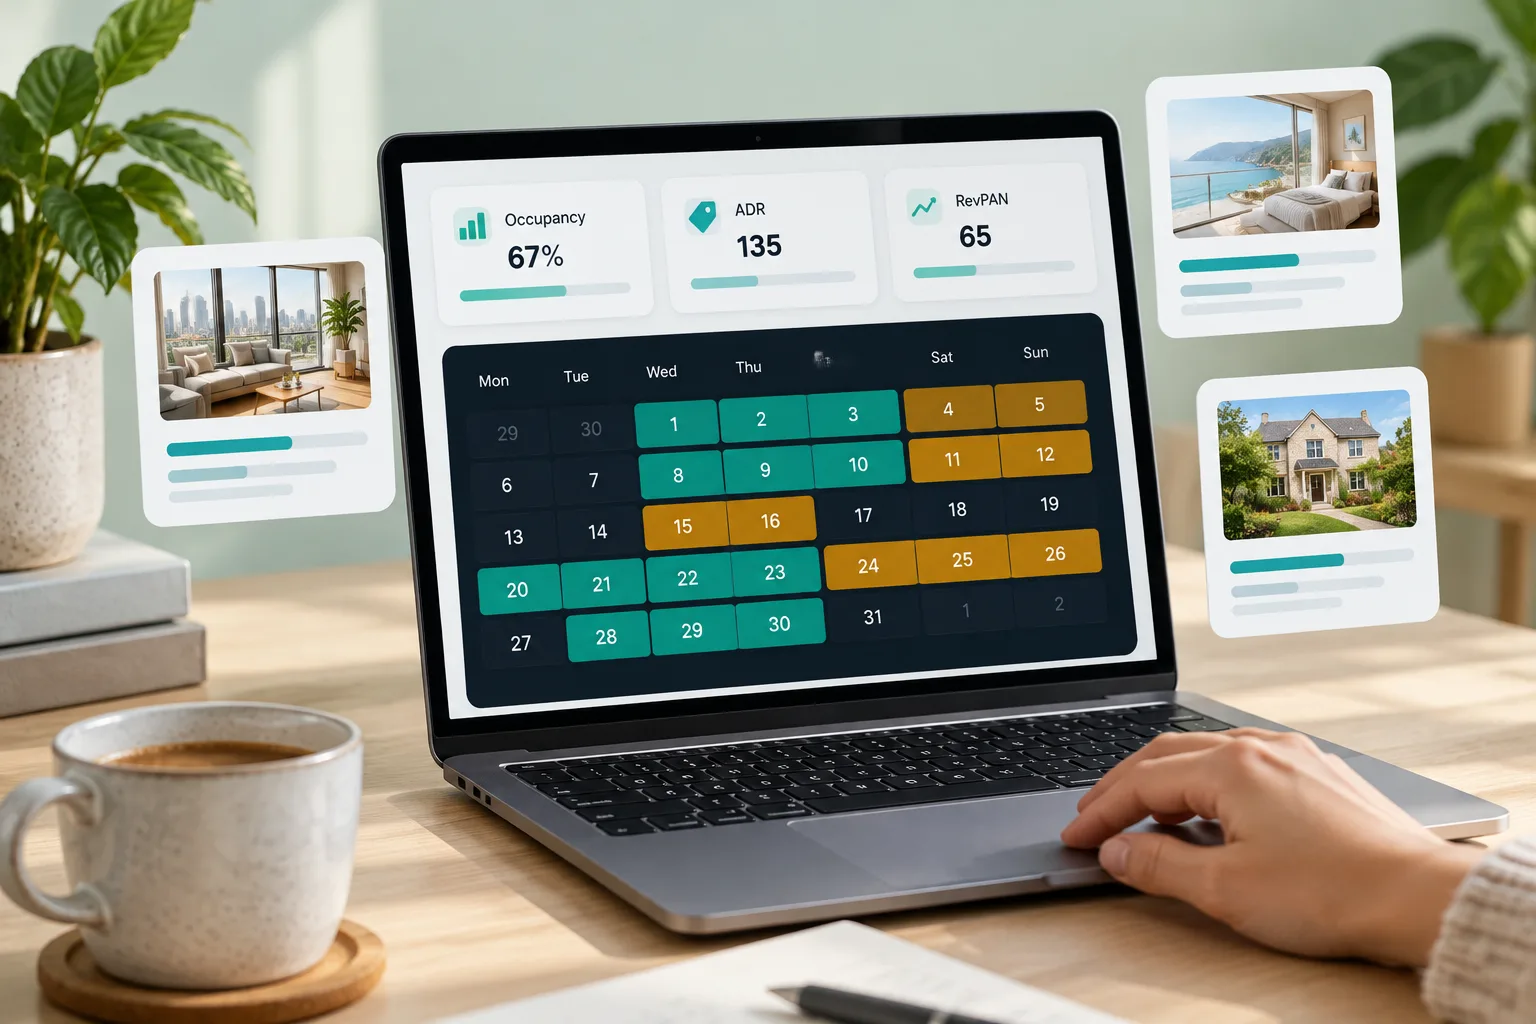
Worked example: if you booked 18 nights from 27 open nights, occupancy is 66.7%. If your total room revenue was 2,430, ADR is 135. If net revenue after cleaning turns and variable costs was 1,760, net RevPAN is 65.19.
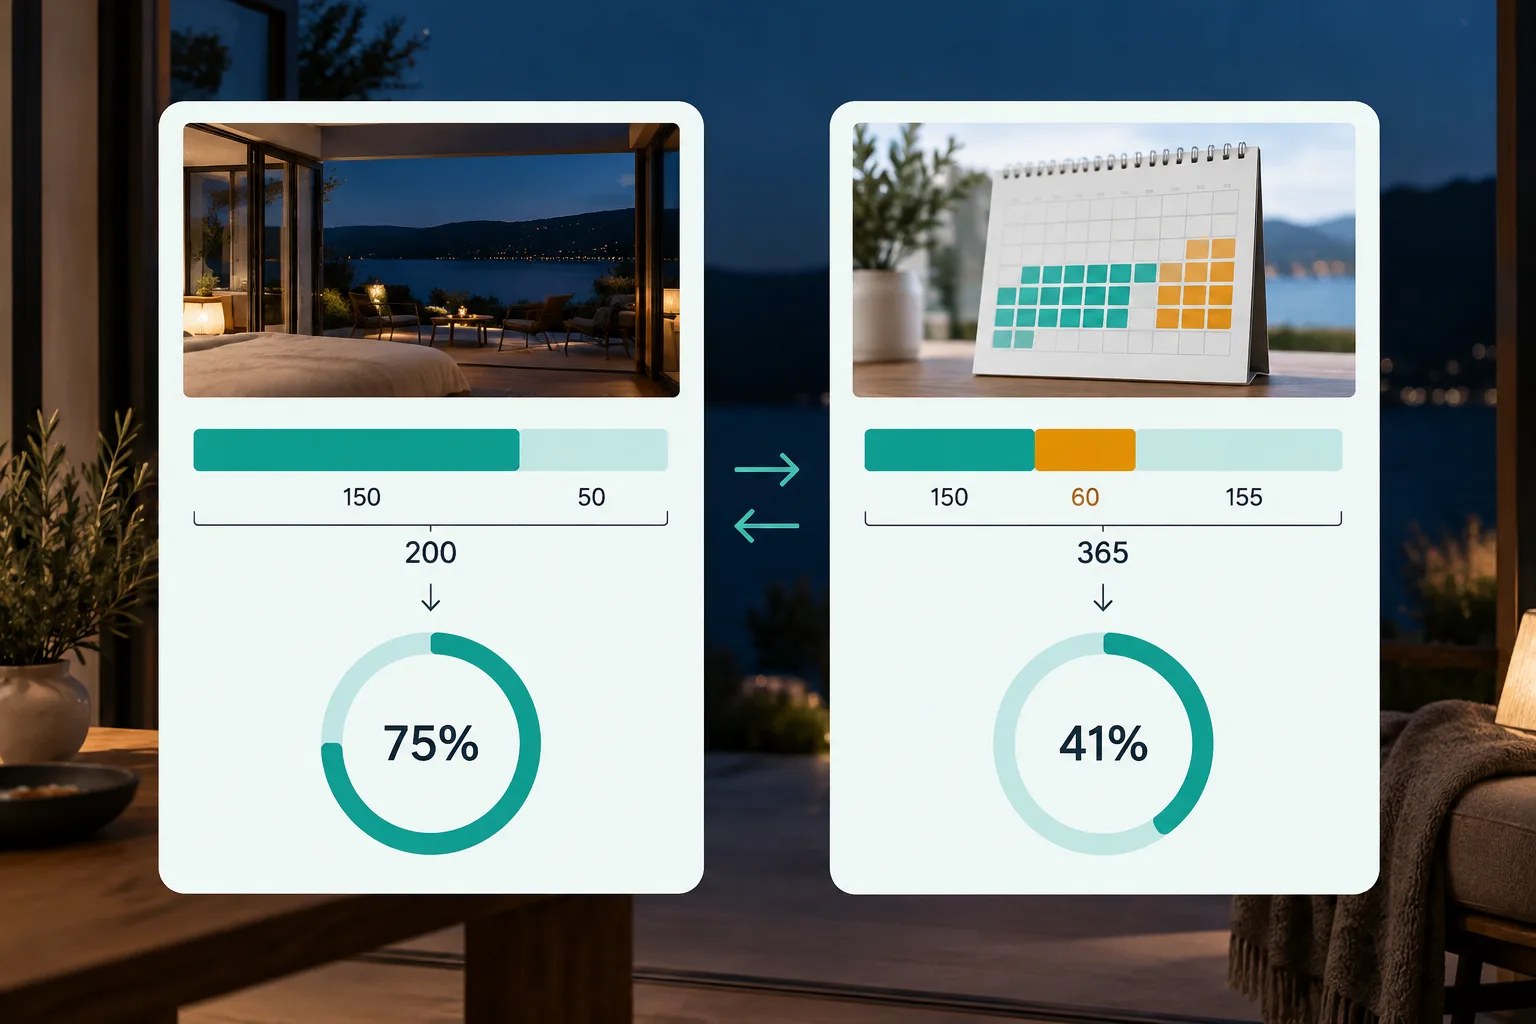
Do not compare that open night result with a source using all 365 nights. That is how hosts end up thinking one report is wrong when it is simply using a different denominator.
The denominator problem: open nights vs calendar nights
This is the gap that confuses most owners. BNBCalc shows the clearest example: a home open 200 nights and booked 150 nights has 75% occupancy on open nights, but 41% calendar occupancy across 365 nights BNBCalc occupancy definition.
Both numbers are useful, but for different jobs.
Use open night occupancy to run the business. It answers: when I make the property available, does it sell? That is the number to use for pricing, photos, minimum stay rules and channel mix.
Use calendar occupancy for investment and lifestyle questions. It answers: how much of the year is this asset earning? That matters if you use the property yourself, have a planning cap, close for refurbishment or run only in season.
AirDNA says it only looks at occupancy when a listing is available to be booked, because many hosts block days for personal use or regulations, and it uses technology to distinguish booked and blocked calendar days AirDNA occupancy method. If you personally use the property or operate under a day cap, report both numbers every month.
How to find the Airbnb occupancy rate in my area
Start with market data, then build your own comp set. AirDNA says its market tools report occupancy, ADR, RevPAR, annual revenue and active listings, and its data is refreshed monthly using the previous month AirDNA occupancy method. BNBCalc also publishes open night occupancy and explains where blocked nights are excluded BNBCalc market method.
Then make a manual comp set of 10 to 20 listings. Match:
- Same neighbourhood, not just same city
- Same bedroom count and guest capacity
- Similar finish, parking, outdoor space and work space
- Similar review score and review count
- Similar minimum stay and cancellation policy
- Same main channels where possible
Listing name: {comp name}
URL: {listing URL}
Distance from us: {minutes walk or miles}
Bedrooms: {number}
Sleeps: {number}
Review score: {score}
Review count: {count}
Main amenities: {parking, hot tub, desk, pets}
Minimum stay seen: {nights}
Available next 30 nights: {count}
Available next 60 nights: {count}
Available next 90 nights: {count}
Observed ADR: {average visible nightly rate}
Notes: {why this is or is not a true comp}
Visible availability is not the same as bookings. A blocked night could be an owner stay, maintenance or a calendar not opened far enough ahead. Use the comp set for direction, not forensic truth.
Occupancy vs ADR vs RevPAN
Occupancy alone can make you poorer. ADR, or average daily rate, is revenue per booked night. RevPAR or RevPAN, revenue per available night, combines ADR and occupancy. AirDNA defines RevPAR as ADR times occupancy, and uses it to show seasonality and market performance AirDNA RevPAR definition.
Simple gross comparison:
- Option A: 80% occupancy at 100 ADR gives 80 gross RevPAN
- Option B: 60% occupancy at 150 ADR gives 90 gross RevPAN
Now add operations. Suppose Option A creates 12 cleaning turns and Option B creates 8 cleaning turns in the same month. If each clean costs 45 and each booked night carries 10 of variable cost, the lower occupancy month may also have less laundry, fewer messages, fewer small damages and better net revenue.
That is why small hosts should track net RevPAN, not just Airbnb occupancy rate. A full calendar with low nightly rate, high cleaning workload and more guest wear can look good inside the app while doing nothing for the owner report.
This is where a dynamic pricing engine for Airbnb hosts should read pace and gap nights, not just copy last year. Your floor, ceiling and cost base matter more than a generic push for more nights.
When low occupancy is a pricing problem
Low occupancy is not always a price problem. Diagnose the failure point first.
If impressions are low, you have a visibility issue. Airbnb says search ranking is influenced by quality, popularity, price and location, with photos, reviews, communication, cancellations, amenities, availability and flexibility also playing a role Airbnb search factors.
If views are decent but bookings are low, you have a conversion issue. Check the first photo, title, total price, cleaning fee, sleeping layout, review score, cancellation policy and whether your best amenities are obvious.
If bookings are strong but the calendar has odd empty nights, you have a rules issue. Airbnb says lowering minimum trip length can help fill gaps, and gives the example of a 5 night minimum blocking a 4 night gap between reservations Airbnb availability settings.
If occupancy is high but revenue is weak, you are likely underpriced. Raise future dates first rather than punishing near term demand.
A 30 minute audit
- Search your own dates as a guest for 2, 4 and 7 night stays.
- Compare total price, not just nightly rate.
- Check the first 5 photos on mobile.
- Count gap nights in the next 60 days.
- Review every rule that blocks check in, checkout or short stays.
- Compare your ADR and RevPAN with your comp set.
- Pick one change for the next 14 days.
Fast levers to raise occupancy without discounting everything
Do not start with a blanket discount. Start with the constraint.
| Lever | Use when | Expected effect | Risk |
|---|---|---|---|
| Gap night rule | You have 1 or 2 empty nights between stays | Fills orphan gaps | More cleaning pressure |
| Lower near term minimum stay | You are soft inside 7 to 14 days | Adds late bookings | Weak guests if price falls too far |
| Peak weekend minimum stay | Peak weekends sell too quickly | Protects ADR | Can block shorter high value stays |
| Better first photo | Views are low or click through is weak | More listing engagement | Needs honest presentation |
| Faster replies | Many guests ask before booking | Higher conversion | Hard to maintain manually |
| Add channels | Airbnb demand is not enough | Wider demand pool | Needs strict calendar control |
Airbnb says hosts can set custom trip lengths, preparation time, booking windows and calendar sync, and that syncing calendars with other calendars helps avoid double bookings Airbnb calendar management. If you add Booking.com, Vrbo, Expedia or direct bookings, read our guide on how to sync Airbnb and Booking.com calendars and our checklist on how to avoid Airbnb double bookings.

Pricing strategy: target occupancy by lead time
Pacing is the weekly answer to panic pricing. You do not need 70% occupancy 90 days out in every market. You need to know whether your booked nights are ahead or behind similar listings for the same arrival window.
A simple city apartment pacing rule:
- 90 days out: hold rate unless major events are weak
- 60 days out: compare weekends and midweek separately
- 30 days out: if behind, test a 5% to 10% price move or a targeted promotion
- 14 days out: open shorter stays if cleaning allows
- 7 days out: fill gaps only if net revenue stays positive
A holiday let is different. Peak school holiday weeks should not be cheap 90 days out if they normally book later at a stronger ADR. Low winter weekdays may need a longer stay discount rather than a nightly rate cut.
Airbnb says its earnings estimate uses the past 12 months of data from similar listings, but actual earnings depend on availability, price and local demand Airbnb earnings estimate method. Use that same logic in your own pricing: similar homes, same dates, real availability, and no panic changes every morning.
PRODUCT
Channel mix for a small portfolio
Airbnb only can work in some markets. It can also cap demand, especially for serviced accommodation, city apartments and repeat business stays where guests search beyond one platform.
Think of the channels by demand type. Airbnb is strong for leisure discovery and trust. Booking.com is often useful for city and late demand. Vrbo can suit whole homes and family groups. Direct booking is for repeat guests, corporate bookers and people who already know the property.
The danger is not adding a channel. The danger is adding a channel without one calendar in the middle. YourFrontDesk puts Airbnb, Booking.com, Expedia, Vrbo and direct bookings on one calendar, and builds the housekeeping list from checkouts. If you are moving beyond one channel, use a proper process before chasing more occupancy. The tools for hosts and short let managers page explains how the operating layer fits together.
Messages matter too. More channels usually means more guest questions. A clear saved answer system, or Airbnb automated messages from booking to review, protects response speed without making every stay feel ignored.
UK Airbnb occupancy rate benchmarks
For UK hosts, do not use a single national Airbnb occupancy rate UK target. London, Edinburgh, Bath, Cornwall, York, Blackpool, rural Scotland and commuter serviced accommodation behave differently.
VisitBritain and Lighthouse publish UK short term rental reporting across Airbnb, Booking.com, Vrbo and Tripadvisor, with deduplication when the same property appears on more than one platform VisitBritain UK short term rentals. Their June 2026 note says UK reserved nights and occupancy rates remained stable against the previous year, while ADR and average revenues reached a new June peak VisitBritain UK short term rentals.
Regulation changes the denominator. In Greater London, Airbnb says entire home listings are automatically limited to 90 booked nights per calendar year unless the host confirms relevant permission Airbnb London 90 night limit. London City Hall also states that planning permission is needed when short term letting of a London property adds up to more than 90 nights in a calendar year London short term letting guidance.
If you operate under a cap, open night occupancy may look excellent while calendar occupancy looks low. Report both, or your owner report will tell the wrong story.
Monthly review template for 1 to 10 units
Run this review once a month, per unit. It should take less than an hour once the sheet is built.
Unit: {unit name}
Open nights: {number}
Booked nights: {number}
Occupancy: {percentage}
ADR: {amount}
Gross RevPAN: {amount}
Net RevPAN: {amount}
Cleaning turns: {number}
Gap nights next 60 days: {number}
Review score: {score}
Response time: {time}
Cancellation count: {number}
Channel split: {Airbnb percentage, Booking.com percentage, Vrbo percentage, direct percentage}
Comp occupancy: {percentage}
Comp ADR: {amount}
Decision: {raise rates, hold, improve listing, open channel, relax rule, accept lower occupancy}
Owner note: {one sentence explanation}
Three examples:
- Underpriced studio: 82% occupancy, weak RevPAN, booked too far ahead. Raise future rates and protect event dates.
- Seasonal cottage: 38% annual occupancy, strong summer ADR, quiet winter. Do not panic if annual profit is healthy, focus on shoulder season packages.
- Large family house: 48% occupancy, high ADR, low cleaning turns, strong net RevPAN. Accept lower occupancy unless comp data shows missed peak demand.
Use this decision rule. If occupancy is low and ADR is high, check visibility and conversion before cutting. If occupancy is high and RevPAN is low, raise prices. If occupancy is average but profit is poor, reduce variable cost or change stay rules. If you have lots of orphan gaps, fix rules before touching base price.
Next steps
A good occupancy target is not found once. It is reviewed every month against local comps, open nights, ADR, RevPAN, rules, reviews and channel split.
If you want one calendar, guest messages, arrivals, housekeeping, owner reports and pricing pace in one place, try the instant YourFrontDesk demo.
What people ask next
What is a good occupancy rate for an Airbnb?
A good occupancy rate is one that beats similar local listings while still producing profit. As a rough working target, many year round city listings aim around 55% to 75%, while seasonal homes can be healthy at lower annual occupancy if peak ADR is strong.
How do you calculate Airbnb occupancy rate?
Divide booked nights by available nights, then multiply by 100. For operating decisions, available nights should mean nights the property was open for guests to book, not owner stays or maintenance blocks.
Is 50% occupancy good for Airbnb?
It can be good in a seasonal, rural or large home market, especially if ADR is high and cleaning turns are controlled. It may be weak for a mature city apartment if similar listings are running materially higher.
Is 70% occupancy good for Airbnb?
Yes, 70% is usually strong if the nightly rate and net revenue are also healthy. If you are at 70% far ahead of arrival, check whether you are selling peak dates too cheaply.
Can Airbnb occupancy be too high?
Yes. Very high occupancy for long periods can mean prices are too low, minimum stays are too relaxed, or you are taking too many low value turns.
What is the difference between occupancy rate and booking rate?
Occupancy rate measures how many available nights were booked. Booking rate usually refers to conversion, meaning how often views or enquiries turn into bookings.
Should blocked nights count in occupancy rate?
For day to day performance, no. Owner stays, maintenance blocks and regulation blocks were not available to sell, so they should be excluded from open night occupancy.
What is a good Airbnb occupancy rate in the UK?
There is no single UK target. A London serviced apartment, a Cornwall holiday cottage and an Edinburgh festival flat should each be judged against local seasonality, rules, ADR and similar listings.